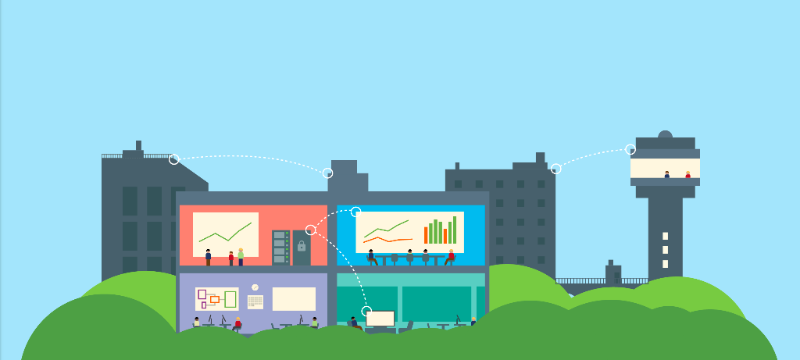
Three thought provoking trends in a recent interview on “The Internet of Things: A new evolution for business” with Yodit Stanton, CEO of OpenSensors, by Joyce Shen, Global Director of Emerging Technologies for Thompson Reuters.
Yodit Stanton on “The Internet of Things: a New Evolution for Business”

Q: Beyond 2017, what trends do you see emerging with the increasing amount of IoT data and effective use of IoT data by businesses?
Yodit: We see three medium-term trends with major impact on businesses — better asset utilization, data visualization that better drives actual change (maps/floor plans/heat maps), and the combining of private and open / public data to gain insights.Yodit Stanton, CEO of OpenSensors interviewed by Joyce Shen in “The Internet of Things: A new evolution for business”
At a high level Stanton is predicting three activities that will be the medium term driver for Internet of Things (IoT) sensor networks creating value for business:
- Substituting more frequent and often more accurate automated inspection of plant and equipment use for manual inspection and monitoring.
- Using visualizations and dashboards to provide facilities managers both high level view and the ability to drill down into details, this becomes a requirement as the amount of data that IoT networks generate can be orders of magnitude more information records from manual inspection.
- Using public data to both add context and complementary information to privately collected data, in particular weather data on the micro-climate for a facility can provide useful insights.
Better asset utilization
Asset utilization and management will continue to gain traction and save companies significant expense by being able to:
- Monitor industrial equipment on-the-fly.
- Automatically schedule maintenance and repairs.
- Expand throughput; for example, remote shipping sensors can be used to manage the infrastructure surrounding space-constrained resources like ports (shipping lanes, roads, and bridges). Using IoT sensors allows them to accommodate expansion by increasing throughput, making the system run more smoothly.
For example, we helped create this map of a busy port showing real-time marine traffic. You can view not only the utilization of shipping lanes, but also view the vessels’ position and destination.
Yodit Stanton, CEO of OpenSensors interviewed by Joyce Shen in “The Internet of Things: A new evolution for business”
David Gelertner’s 1991 book “Mirror Worlds” opens with this prediction:
“This book describes an event that will happen someday soon: you will look into your computer screen and see reality. Some part of your world–the town you live in, the company you work for, your school system, the city hospital–will hang there in a sharp color image, abstract but recognizable, moving subtly in a thousand places. This Mirror World you are looking at is fed by a steady rush of new data pouring in through cables. It is infiltrated by your own software creatures, doing your business.”
David Gelertner “Mirror Worlds” (1991)
The Internet of Things (IoT)–a new name for the well established paradigm of sensor networks–is now making this a reality.
Data visualization drives change
Today, for most businesses most data still resides in an Excel sheet as a time series. We see more powerful use cases where the data overlaid on a map like the port shipping data shown above. This map visualization provides greater information density.
Another example is a floor plan with an office occupancy heat map — presenting a spatial view of the data that is more useful than what you would see in a spreadsheet. For example, below is an office floor plan where we show the utilization of desks. You can also view the footfall in the busy corridors and the pattern of usage in the building for desks, conference rooms, and break rooms.
We did something like this for Zaha Hadid Architects, helping enable them to use data-driven design where they are able to better understand the client needs and take the guesswork out of the design process.
Yodit Stanton, CEO of OpenSensors interviewed by Joyce Shen in “The Internet of Things: A new evolution for business”
Visualization allows for two important operations: to zoom in and observe events that might otherwise remain undetected because of their short lifetime, and to zoom out too see larger slower moving trends in aggregated data. With manual inspections that may be taking place on an hourly or daily or weekly basis many short duration events may simply not be logged. By digitizing all of this information you can also easily compare one location to another, one month’s operation to another, or see trends over two or three years that may be lost in daily or weekly fluctuations.
Extracting value from combining public and private data
Open data from community-based sensor networks will be combined with companies’ private sensor network data to get better analytics and better insights.
An example of this is combining parking data from private parking sensor networks with public data like weather data, traffic and road conditions, emergency information and advisories, special event information, and toll/pricing data. A parking management team can then monitor parking lot usage and provide more intelligent and optimized local information about parking space inventory, availability, and conditions by location for their customers.
By looking at patterns of usage, you get a granular understanding of how parking bays are used.
Yodit Stanton, CEO of OpenSensors interviewed by Joyce Shen in “The Internet of Things: A new evolution for business”
I think this may be the most fundamental insight, that sensor networks will not just operate locally to manage a corporation’s assets. That there will be even more insight to be gained by combining private company data with public data and perhaps purchased aggregate data that will provide not only a much richer context and more useful explanations for observed asset utilization (or more broadly, system behavior) but also better predictions for future utilization and behavior.
